The Utah Jazz Aren't Being Cheated. They're Being Averaged.
On Sunday, May 10, 2026, fourteen NBA teams will send a representative to a ballroom in Chicago to watch ping pong balls decide their future 1. Three weeks from now. And if history is any guide, the moment the draft order is revealed, a very specific subset of NBA fans is going to be very sure the whole thing was rigged.
Utah Jazz fans have a particularly rich version of this complaint. They point to the franchise’s long history of lottery appearances and no upward movement 2. They remember last year’s pain: worst record in the league, 14% shot at Cooper Flagg, and a fall all the way to #5 while Dallas, 1.8% odds, walked off with the pick 3. They say the league wants stars in big markets. They say Utah is too small, too flyover, too unglamorous. They say the balls are frozen.
The math says none of that is true. The math says what happened to the Jazz is roughly what probability theory predicts. Here’s the receipt.
The Jazz’s own-pick lottery history, 2006-2025
Nine appearances with their own pick. Never moved up. This is the core of the “cursed” narrative. It is also exactly what you’d expect given the actual odds 2.
| Year | Record | Seed | Odds at #1 | Odds at top 3/4 | Result | Move |
|---|---|---|---|---|---|---|
| 2006 | 41-41 | 14th | 0.5% | 1.8% | #14 | stayed |
| 2011 | 39-43 | 12th | 0.7% | 2.5% | #12 | stayed |
| 2013 | 43-39 | 14th | 0.5% | 1.8% | #14 | stayed |
| 2014 | 25-57 | 4th | 11.9% | 37.5% | #5 | down 1 |
| 2015 | 38-44 | 12th | 0.7% | 2.5% | #12 | stayed |
| 2016 | 40-42 | 12th | 0.7% | 2.5% | #12 | stayed |
| 2023 | 37-45 | 9th | 4.5% | 20.1% | #9 | stayed |
| 2024 | 31-51 | 8th | 6.0% | 26.2% | #10 | down 2 |
| 2025 | 17-65 | 1st | 14.0% | 52.1% | #5 | down 4 |
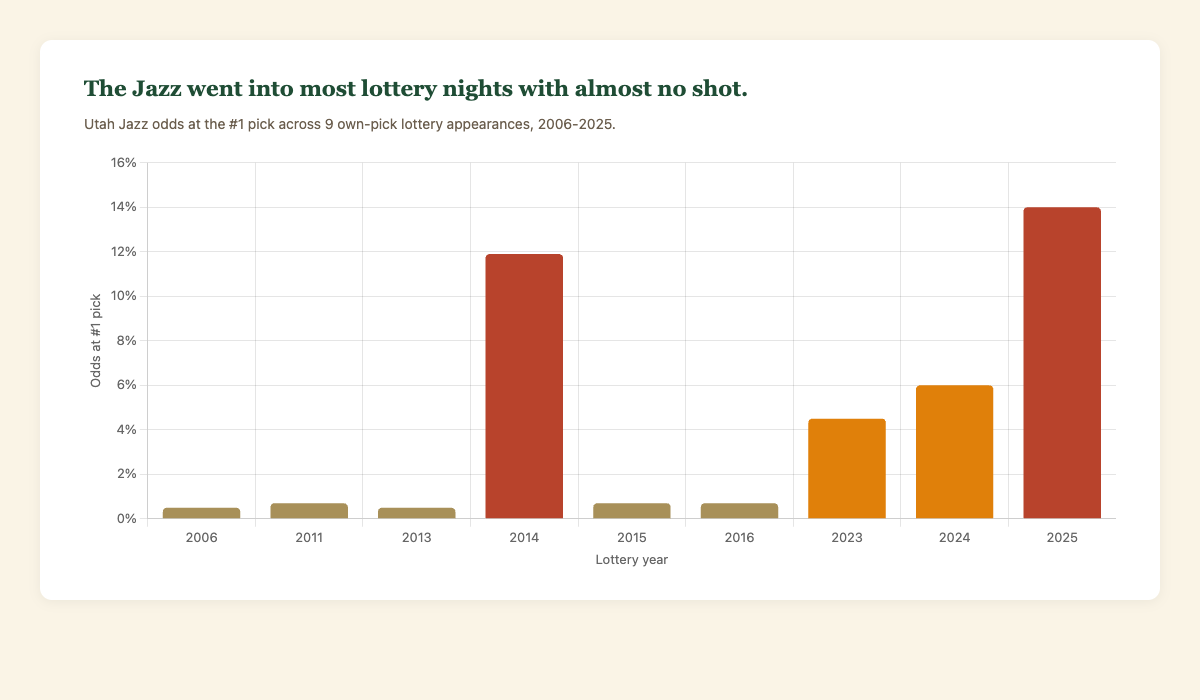
Look at the odds column. Six of those nine years, the Jazz had less than a 3% chance of winning the top pick. At 3%, the expected outcome is “you don’t win.” At 0.7%, the expected outcome is “you don’t win, and it wasn’t really on the table to begin with.” What fans remember as nine painful near-misses were, in most cases, nine near-locks to not happen.
What the aggregate probability actually says
Running the math across all nine own-pick appearances, assuming independence and using the published odds each year:
| Question | Baseline probability | What happened |
|---|---|---|
| Jazz win #1 at least once | 34.1% | Never won |
| Jazz land top 3 or top 4 at least once | 84.2% | Never landed |
| Jazz move up at all in any appearance | 67.1% | Never moved up |
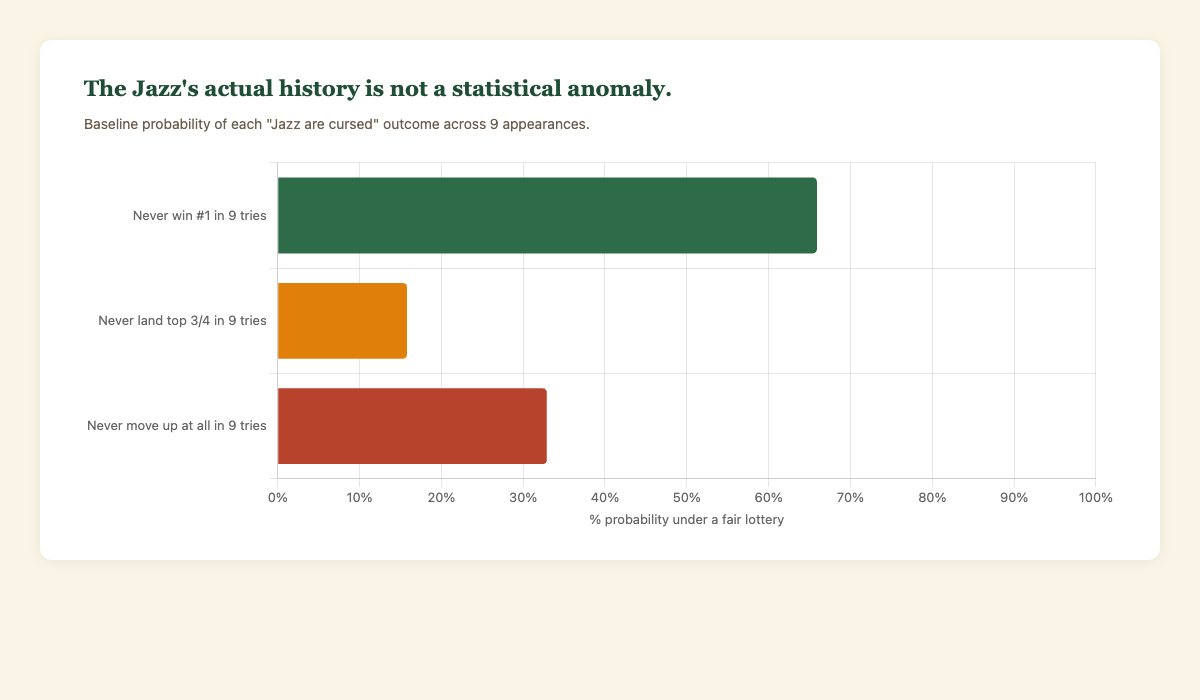
So yes, the Jazz are on the unlucky side of the distribution. “Never moving up across nine appearances” is a 32.9% baseline event. Unlucky. Not anomalous. It’s the same probability as getting dealt two cards of the same color twice in a row. One out of three parallel Jazz franchise histories produces exactly this story.
The 2025 fall felt worse than it was
Last year’s lottery, the one that still has Jazz fans hot, produced the single most painful outcome of the era: worst record, best possible odds, dropped to #5 3. Visceral. And also: a 47.9% probability event under the post-2019 rules, because once you’re at seed 1 there are only two outcomes. Stay in the top 4 (52.1%) or fall all the way to 5 (47.9%). There is no middle ground. A coin flip landed the wrong way.
Detroit took this exact same outcome three years in a row from 2022 through 2024 4 and no one wrote a conspiracy theory about the league having it in for the Pistons.
Even Jazz GM Justin Zanik, asked directly whether the lottery is rigged, put it plainly 5: “It’s definitely not rigged. I guess the main thing is you definitely feel the 14% chance, not the 86% chance that it’s not.”
That’s the whole post in one quote, really. But let’s do the receipts anyway.
The fact that kills the conspiracy
If the NBA were rigging the lottery to put stars in big markets, you’d see it in the Knicks and Lakers. They are the two most valuable franchises in the league, the #1 and #2 TV markets in America 6, the biggest possible beneficiaries of any secret scale-tipping.
- Lottery #1 picks won by the Knicks, 2006-2025: zero.
- Lottery #1 picks won by the Lakers, 2006-2025: zero.
- Lottery #1 picks won by the Celtics in that window: one, via a pick originally owned by Brooklyn that already had the worst-record 25% odds 1, meaning no lottery jump happened at all.
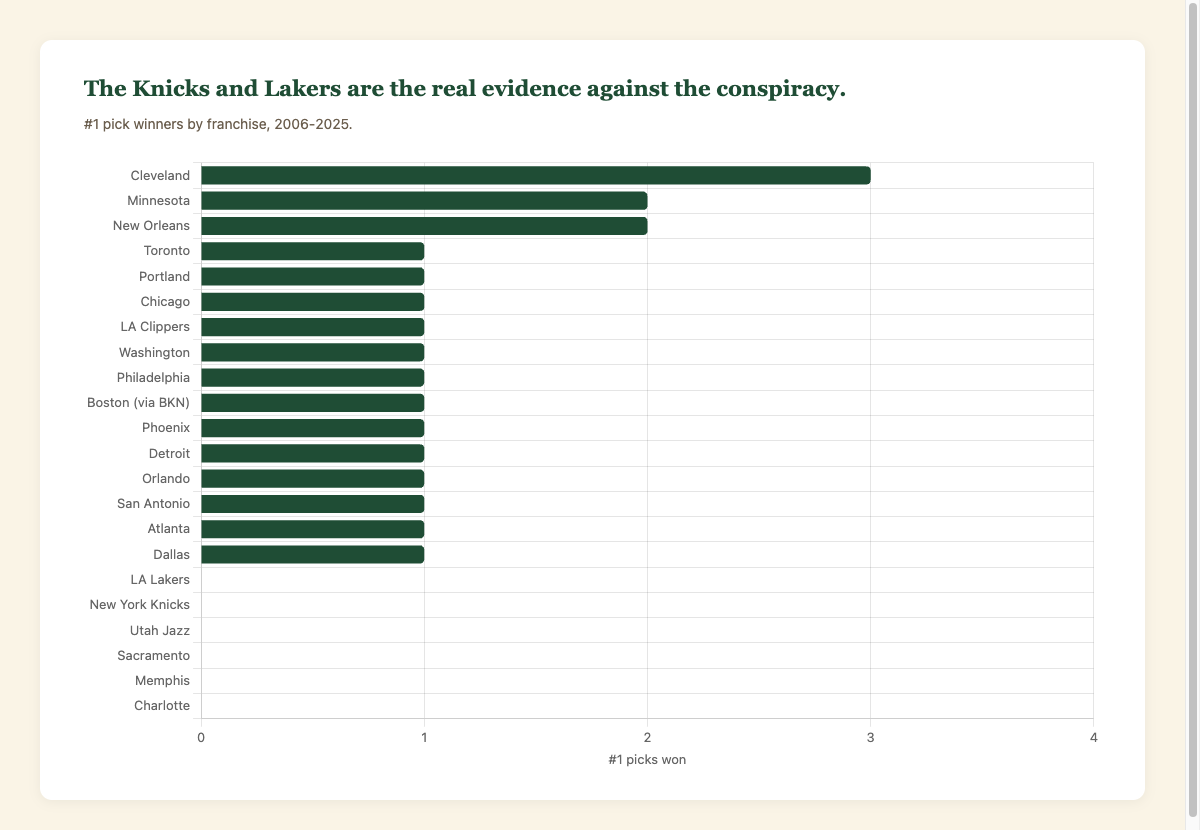
The franchises that have actually “benefited” from the lottery over the past two decades include Cleveland (three wins in four years), Minnesota (two), Orlando, Philadelphia, Phoenix, New Orleans, San Antonio, Detroit 1. These are not glamour markets. If the NBA is rigging, it is doing so with such strategic incompetence that the results are indistinguishable from randomness. Which is another way of saying the results are random.
The statistical tests
Two rigorous published analyses have tested the lottery explicitly for fairness. They both reached the same conclusion.
Squared Statistics analyzed 1994-2017 (24 lotteries) 7:
| Test | Result | Interpretation |
|---|---|---|
| Chi-square statistic | 13.38 (df=13) | Below critical value of 13.64 at 60% confidence |
| Exact permutation test | p = 0.1841 | Not statistically significant |
| Mann-Whitney team analysis | Outliers: MIN, PHI | Neither direction shows systematic bias |
Authors’ own conclusion, quoted directly: “It is safe to say that the NBA Draft Lottery is not fixed.”
A Monte Carlo deep dive covering 1990-2025 simulated the lottery one million times 8:
| Metric | Observed | Simulated mean | Interpretation |
|---|---|---|---|
| Log score | 82.72 | 76.82 | Upper-tail p = 0.099 |
| Log score (excluding 2024-25) | — | — | p = 0.23 |
| Calibration slope (#1 pick) | 0.83 | 1.00 expected | p = 0.416 |
| Calibration slope (top 4) | 1.09 | 1.00 expected | p = 0.322 |
| Calibration R² (#1 pick) | 0.898 | — | Strong fit |
| Calibration R² (top 4) | 0.992 | — | Nearly perfect fit |
Same conclusion: no systematic bias favoring large markets 8. The two most recent years (Atlanta 2024 at 3%, Dallas 2025 at 1.8%) pulled the aggregate closer to significance, but the p-value still doesn’t cross the 0.05 threshold. A third of the way up the “maybe this is weird” hill. Not close to the summit. A third independent analysis from VectorWorks Academy reached the same conclusion by a different method 9.
And running a direct market-tier chi-square on 2006-2025 #1 winners (using Nielsen DMA rankings 6 to group teams into three tiers):
| Market tier | Expected #1 wins | Observed | Delta |
|---|---|---|---|
| Tier 1 (top 10 DMA) | 5.6 | 8 | +2.4 |
| Tier 2 (mid) | 10.8 | 9 | -1.8 |
| Tier 3 (small) | 3.6 | 3 | -0.6 |
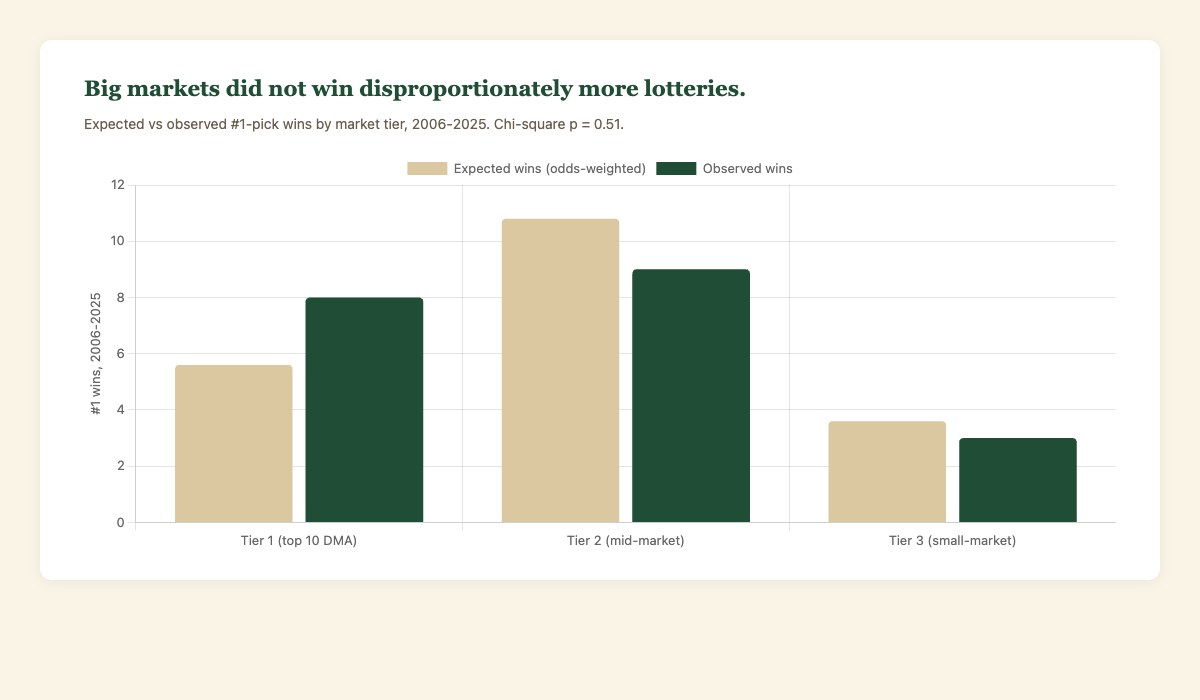
Chi-square = 1.36, df = 2, p = 0.51. You would see a deviation this large or larger roughly half the time under a perfectly fair lottery. The big-market “overage” of +2.4 wins works out to about one extra big-market win every eight years.
Three different tests, three different datasets, three different methods. None of them reject the null hypothesis of fairness. The strongest of them (Monte Carlo) produces a p-value of 0.10, which in plain English is: “this result would happen by random chance about one out of every ten times you ran the experiment.” That is not evidence of rigging. That is evidence of a noisy system behaving noisily.
Why the conspiracy theory survives anyway
Because humans are bad at this. Specifically, three things combine to make lottery conspiracies feel true:
We confuse memorable with representative. Chicago winning at 1.7% in 2008 is a story. Orlando dropping from seed 1 to #2 in 2013 is a footnote. The 2016 lottery, where every team finished in the exact order of their regular-season record (the only time in lottery history this has happened 1), is not a story at all. It is the most statistically beautiful outcome the lottery has ever produced. Nobody remembers it.
We weight recent evidence too heavily. If you believe the lottery is rigged against Utah right now, it is because last year’s fall to #5 is vivid and painful. You do not feel the 2018 lottery where Utah wasn’t even in it because they made the playoffs. You do not feel the 2022 lottery where Orlando jumped from seed 2 to #1 under the same rules. Orlando isn’t a bigger market than Utah. The ping pong balls didn’t check.
We see patterns that aren’t there because we’re looking for them. Give a person 20 independent random events and they will construct a theory of each one. Give them a grievance going in, and they’ll construct a theory that confirms the grievance. This isn’t a failure of Jazz fans specifically. It is a feature of the human nervous system.
The takeaway
The Utah Jazz aren’t being punished by the league. They are being averaged by mathematics. Their nine-appearance lottery history is roughly as unlucky as flipping tails five times in a row. It’s bad variance. It’s the same variance that gave Detroit three max drops in a row, the same variance that let Charlotte post the worst season in NBA history in 2012 and still not win the top pick, the same variance that made Minnesota look “lucky” for winning the lottery twice in six years despite being the league’s 15th-ranked market.
The “rigged” narrative feels good because it gives the pain a shape. It gives the randomness a villain. It replaces “bad things sometimes happen to small markets because probability doesn’t care about zip codes” with “someone did this to us, and that someone can be blamed.”
The actual lesson is less satisfying but more useful: when odds say you have a 14% chance of something good, your brain files that as “we could win” and the universe files it as “you will almost certainly lose.” Both parties are reading the same number and extracting different emotional information from it. The universe is correct. Your brain is doing what brains do.
This is how stats work. Not rigging. Not fixing. Just probability, unfolding.
And on May 10 in Chicago, when the balls drop and someone’s fanbase is very sure the fix was in, the math will still be the math. Someone always has to land on the unlucky tail. That someone is rarely, if ever, the Lakers.
Sources
Footnotes
-
“NBA Draft Lottery,” Wikipedia. Historical lottery structure, year-by-year results, and the 2016 “chalk” outcome. ↩ ↩2 ↩3 ↩4
-
“Utah Jazz Lottery History,” RealGM. Franchise-level lottery appearance record. ↩ ↩2
-
“NBA Draft Lottery results: Jazz’s slide to No. 5 continues tough lottery luck,” CBS Sports. Coverage of the 2025 Jazz lottery outcome. ↩ ↩2
-
“2024 NBA Draft Lottery Odds,” Hoops Rumors. Detroit’s max-drop streak and the 2019-2025 odds structure. ↩
-
“Utah Jazz GM Responds to Whether NBA Draft Lottery is Rigged,” Sports Illustrated. Justin Zanik’s direct response to the conspiracy narrative. ↩
-
“NBA Market Size by Nielsen DMA,” Sports Media Watch. Television market rankings used for the market-tier analysis. ↩ ↩2
-
Gribben, J. (2017). “Is the NBA Draft Lottery Fixed? A Statistical Analysis of 1994-2017,” Squared Statistics. Chi-square, exact permutation, and Mann-Whitney tests across 24 lotteries. ↩
-
Ronel, I. (2025). “Is the NBA Lottery Rigged? Statistical Deep Dive (1990-2025),” Medium. 1,000,000-simulation Monte Carlo analysis with calibration curves. ↩ ↩2
-
VectorWorks Academy. “Is the NBA Draft Lottery Rigged? A Data Scientist’s Perspective,” Medium. Independent statistical examination reaching the same conclusion. ↩